Journal: bioRxiv
Article Title: Secreted antigen A peptidoglycan hydrolase is essential for Enterococcus faecium cell separation and priming of immune checkpoint inhibitor cancer therapy
doi: 10.1101/2023.11.19.567738
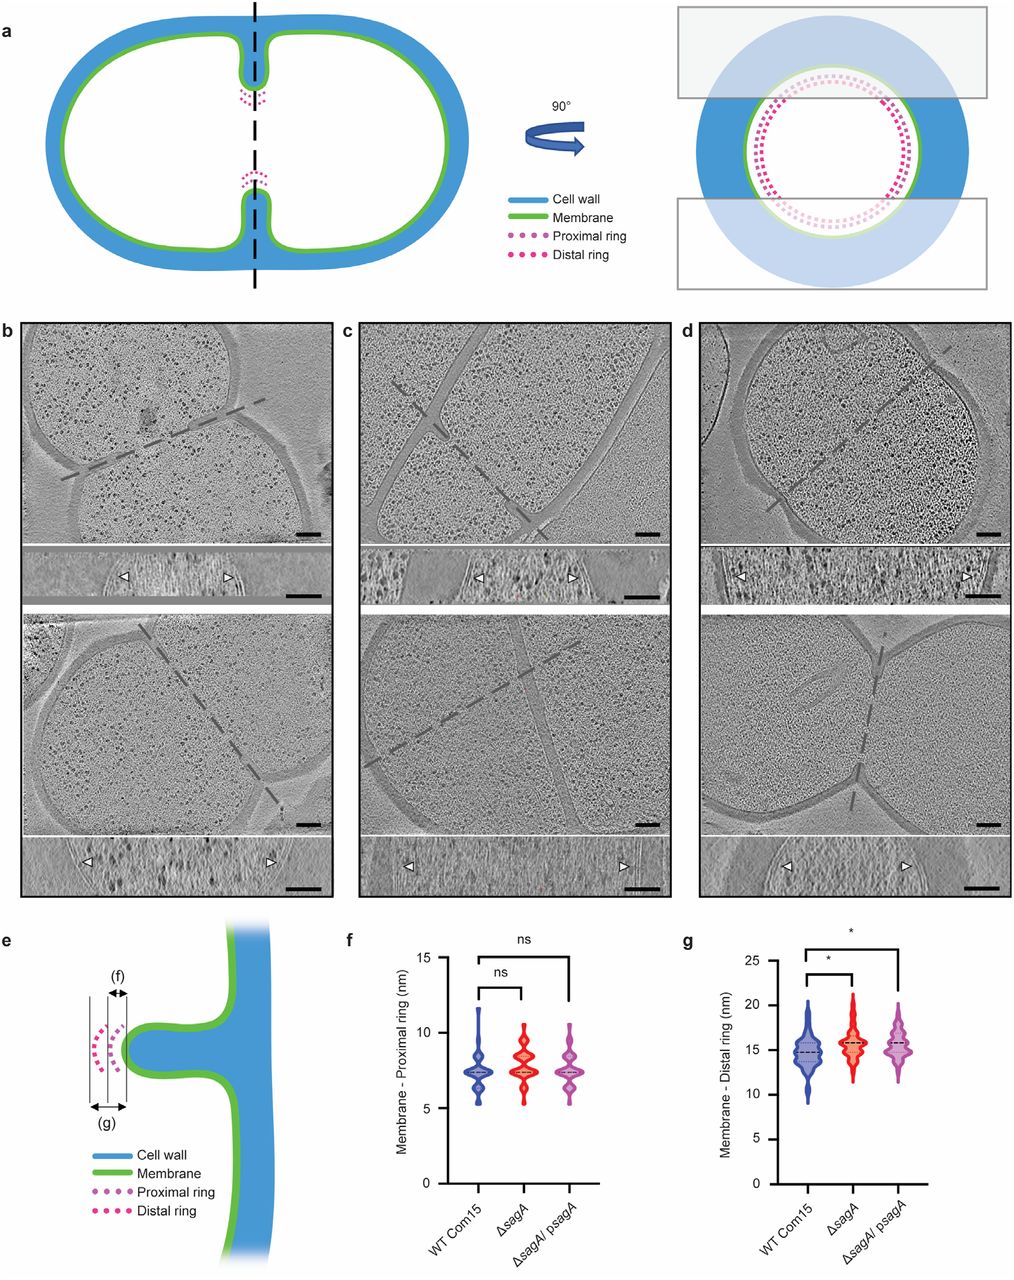
Figure Lengend Snippet: a , Representative cryo-ET images of E. faecium WT Com15, Δ sagA , and Δ sagA /p sagA are shown in the top row. The cell wall, septum, divisome, and ribosome are indicated by white arrows. 3D segmentations are shown in the bottom row. The cell wall is annotated in blue, the membrane in green, and the divisome in magenta. Scale bar = 100 nm. b , The upper panel shows a diagram illustrating how measurements are collected. In the lower panel, a representative cryo-ET image of the septum is shown. Scale bar = 50 nm. c , Comparison of cell wall thickness. The violin plot displays the distribution of cell wall thickness, with E. faecium WT Com15 WT (n=66) shown in blue, ΔsagA (n=96) shown in red, and ΔsagA / p sagA (n=69) shown in magenta. Black dotted lines represent median ( E. faecium WT Com15 WT: 47.48nm, ΔsagA : 50.11nm, ΔsagA / p sagA : 46.42nm) while the colored dotted lines represent quartiles. Welch’s t test was used to calculate statistical significance. ns, P ≥ 0.05. d , Comparison of septum thickness. The violin plot displays the distribution of septum thickness, with E. faecium WT Com15 WT (n=26) shown in blue, ΔsagA (n=62) shown in red, and ΔsagA /p sagA (n=16) shown in magenta. Black dotted lines represent median ( E. faecium WT Com15: 54.33nm, ΔsagA : 54.86nm, ΔsagA / p sagA : 57.50nm) while the colored dotted lines represent quartiles. Welch’s t test was used to calculate statistical significance. ns, P ≥ 0.05. ( e ) Comparison of divisome architecture. To assess potential alterations in the divisome architecture, the distance between the apical end of the septum and the membrane-proximal ring was divided by the distance between the apical end of the septum and the membrane-distal ring. The violin plot displays the distribution of the ratios, with E. faecium WT Com15 WT (n=31) shown in blue, ΔsagA (n=40) shown in red, and ΔsagA / p sagA (n=42) shown in magenta. Black dotted lines represent median ( E. faecium WT Com15: 0.5, ΔsagA : 0.5, ΔsagA / p sagA : 0.5) while the colored dotted lines represent quartiles. Welch’s t test was used to calculate statistical significance. ns, P ≥ 0.05.
Article Snippet: Fecal samples were weighed, resuspended in sterile PBS, homogenized by douncing with sterile pestles, serially diluted in sterile PBS, and then plated by drip assay onto selective HiCromeTM Enterococcus faecium Agar plates (HIMEDIA 1580) with Enterococcus faecium selective supplement (FD226, HIMEDIA).
Techniques: Tomography, Membrane, Comparison